
Editor’s note: A new Texas climate report is challenging claims that climate change is driving increasingly extreme weather across the state, pointing to historical data showing no sustained rise in 100-degree days, no upward trend in Texas hurricane or tornado frequency, and no increase in wildfires or acres burned during the periods examined.
The Texas State Climate Assessment, released Sept. 29 by The Heartland Institute’s Climate at a Glance project, draws on data from the National Oceanic and Atmospheric Administration (NOAA), the U.S. Department of Agriculture and other government sources to argue that more than a century of Texas weather records tells a far more complicated story than the “climate crisis” narrative often presented to the public.
Texas has warmed by nearly 1.5 degrees since 1900, yet the state has not recorded a sustained rise in the number of days reaching 100 degrees or higher across that same span, according to a new assessment of Texas weather records.
The Texas State Climate Assessment, released Sept. 29 by The Heartland Institute’s Climate at a Glance project, draws upon data from the National Oceanic and Atmospheric Administration (NOAA), the U.S. Department of Agriculture and other government sources. Heartland, an Illinois-based free-market research and policy organization, presents its findings as a challenge to coverage that describes a hot season, a drought or a destructive storm as evidence that Texas is already experiencing a climate crisis.

The report finds no sustained increase in extremely hot days, no upward trend in Texas hurricane or tornado frequency and no rise in either the number of wildfires or the acreage burned during the period covered by the available statewide fire data. It also documents substantial long-term gains in cotton and corn yields.
Sterling Burnett, Ph.D., director of the Arthur B. Robinson Center on Climate and Environmental Policy at The Heartland Institute, said recent conditions must be compared with the full historical record before they can be described as exceptional.
Climate is evaluated over periods of 30 years, Burnett told Katy Christian Magazine. A few unusually hot or dry years can attract extensive coverage while revealing little about whether the underlying pattern has changed.
“To know whether human greenhouse gas emissions are contributing to climate change, much less dangerous climate change, one must compare whether similar conditions occurred in the past when emissions and temperatures were lower,” Burnett said.
A Look at What More Than a Century of Texas Heat Records Shows
The assessment’s temperature analysis begins by examining a finding contained in NOAA’s own 2022 Texas State Climate Summary: Texas temperatures have risen by almost 1.5 degrees since the beginning of the 20th century, while the number of extremely hot days has shown no overall trend.
NOAA defines an extremely hot day in this dataset as one with a maximum temperature of at least 100 degrees. Its chart is drawn from 24 long-running weather stations and covers 1900 through 2020.
Five-year averages were generally above the century-long norm from 1910 through the early 1960s. They have remained near or below it since then, apart from the 2010-14 period. The extraordinary summer of 2011 produced roughly 67 days at or above 100 degrees, more than 20 days above any other year in the series.
“With the exception of a single year, an outlier, there has been no sustained increase in triple-digit days,” Burnett said.
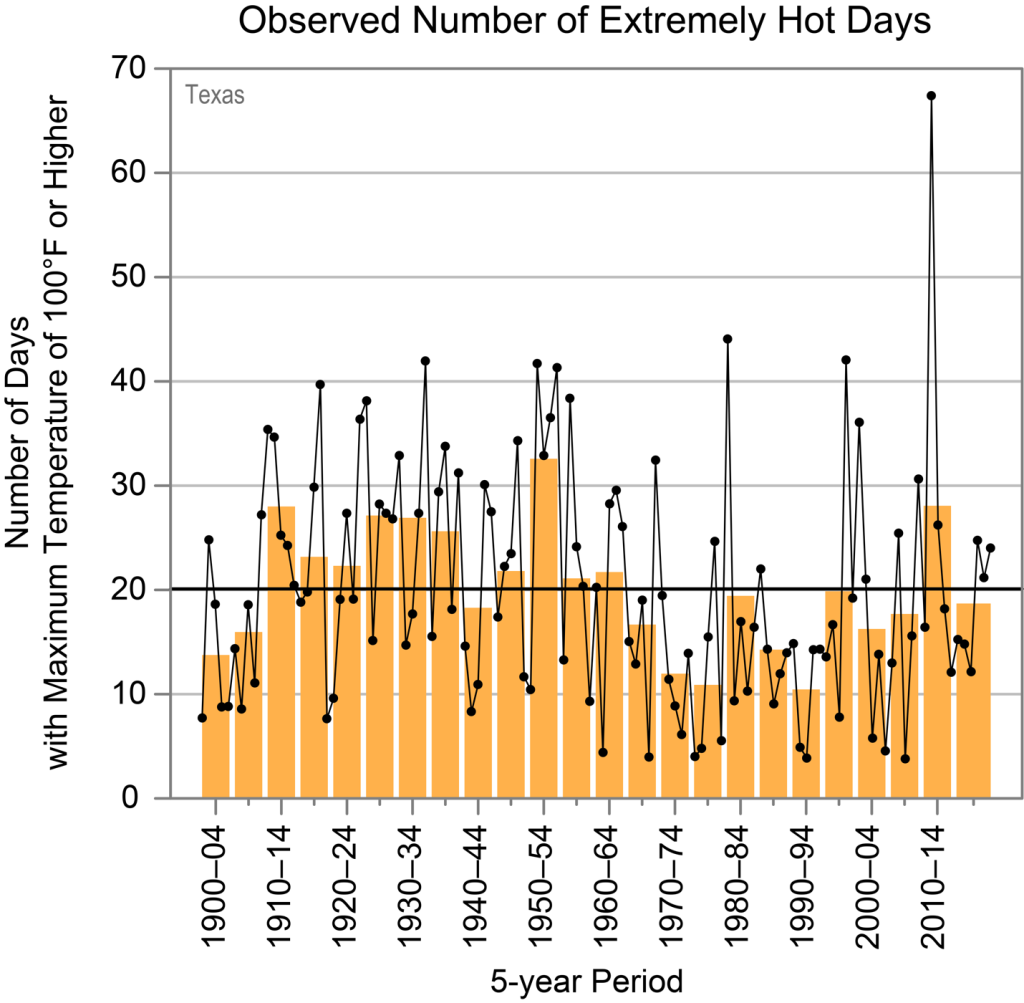 Observed number of very hot days since 1900. Dots are annual values. Blue bars show averages over a 5-year period, though the last bar is a 6-year average. The horizontal black line shows the average of the entire period. Chart from Jennifer Runkle and Kenneth E. Kunkel, State Climate Summaries 2022: Texas, National Centers for Environmental Information.
He also pointed to the state’s highest recorded temperature. Texas reached 120 degrees at Seymour on Aug. 12, 1936, then tied that record near Monahans on June 28, 1994, according to NOAA’s State Climate Extremes Committee.
NOAA’s Texas summary contains another finding that often appears forgotten in discourse about daytime heat: Very warm nights became considerably more common during the 2010s. The Heartland assessment argues that this pattern, together with the lack of a corresponding rise in extreme daytime highs, points toward urban development as an important part of Texas’ measured warming.
The historical trend does not make an individual heat wave harmless. Temperatures above 100 degrees can cause heat exhaustion, heatstroke and death, particularly when people work outside or lack reliable air conditioning. Katy Christian Magazine’s guide to staying safe during the summer heat offers practical precautions for dangerous days. Burnett’s argument concerns the long-term frequency of those days rather than the immediate risk created by any one event.
NOAA’s summary also projects more extreme heat later this century under its modeled emissions scenarios. The Heartland report concentrates on the observed record and argues that recent conditions should be described from measurements rather than treated as confirmation of a future projection.
Texas Cities Are Staying Warmer at Night
Dallas-Fort Worth, Houston and Austin each added more than 500,000 residents between 2010 and 2022. As those metropolitan areas spread outward, fields and open land gave way to pavement, roofs, vehicles, air-conditioning systems and other heat-producing infrastructure.
Concrete and asphalt absorb solar energy during the day and release it after sunset. Buildings can restrict airflow, while machinery and cooling systems discharge additional heat. The result is an urban heat island (UHI) that often appears most clearly in higher nighttime temperatures.
Burnett said he could not assign a precise share of Texas’ warming to the urban heat island effect. He cited research estimating that urbanization may account for 30% to more than 50% of measured warming in parts of the United States. A 2025 study published in the American Meteorological Society’s Journal of Applied Meteorology and Climatology examined urban heat island effects in U.S. summer temperature data from 1895 through 2023.
“Based on the pattern of warming — higher nighttime lows or minimums with no significant change in daytime highs — UHI is almost certainly a factor,” Burnett said.
Given Texas’ rapid population growth and expanding cities, he believes its influence here is at least as large as the national average.
The same growth that can affect nighttime readings also increases the consequences of severe weather. More homes, roads and businesses in exposed areas create more property that can be damaged. Katy Christian Magazine’s reporting on what went wrong with Houston power during the 2021 freeze and its examination of the storm’s energy and economic consequences illustrate how infrastructure, population and preparedness can determine the human cost of an extreme event.
Drought, Wildfires, Hurricanes and Tornadoes

Texas precipitation varies sharply by region and from one year to the next. Far West Texas receives a fraction of the annual rainfall common in the eastern portion of the state, and prolonged dry periods have shaped Texas history for centuries.
The Heartland assessment identifies a slight long-term increase in statewide annual precipitation. It also places recent droughts beside earlier episodes, particularly the drought of the 1950s. NOAA identifies 1917, 1956 and 2011 as the three driest calendar years in the modern Texas record. The driest consecutive five-year period ran from 1952 through 1956.
Burnett said this history provides essential context for reports about present-day reservoir levels and water shortages. Recent drought has caused real hardship in parts of Texas, he said, but the statewide record contains dry periods of comparable or greater duration from decades when atmospheric greenhouse gas concentrations were lower.
The report applies the same approach to fire and storms. Using National Interagency Coordination Center annual reports, it charts the number of Texas wildfires and acres burned since 2006. Burnett said neither measure shows an upward trend during that period.
“One can’t just look at a single year or a couple of years’ wildfire numbers and say climate change is responsible,” Burnett said. “One must look at longer-term trends.”
Texas’ fire record is shorter than the temperature record, and individual seasons can vary enormously. The 2011 season burned nearly 4 million acres, while other years produced many fires over a much smaller total area. The assessment therefore treats fire count and acreage as separate measurements.
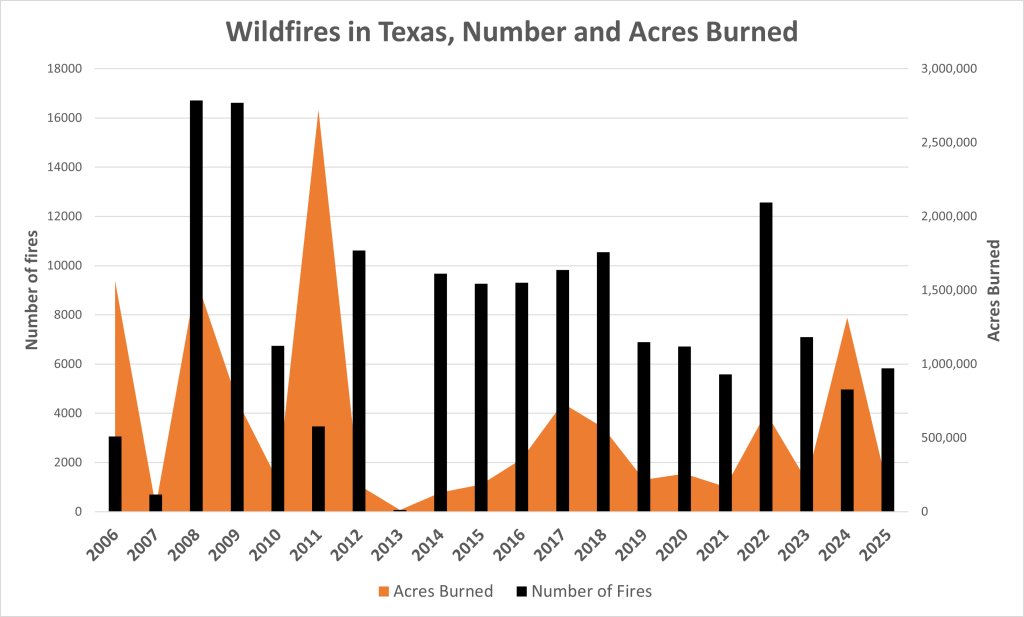 Total Acres burned and number of wildfires in Texas since 2006. Data from National Interagency Fire Center annual reports.
Its hurricane chart groups Texas landfalls into five-year intervals beginning in 1900 and finds no rising trend in the number of storms. That conclusion is consistent with NOAA’s broader finding that the historical record contains no strong evidence of a century-scale increase in U.S. landfalling hurricanes or major hurricanes. NOAA scientists separately project that a warmer climate could increase hurricane rainfall rates and the intensity of the strongest storms, even as the historical count of landfalls lacks an upward trend.
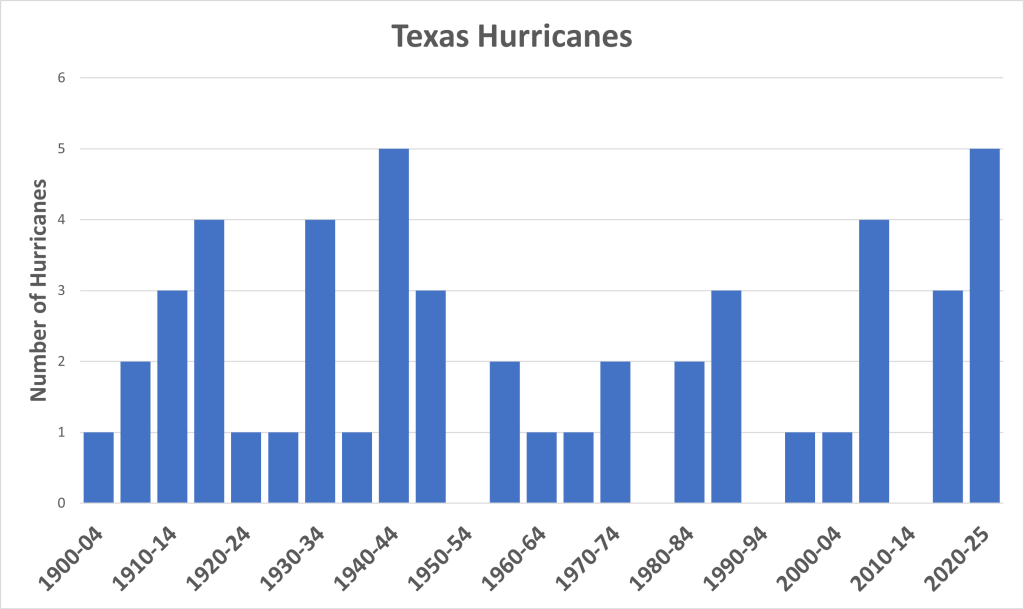 Hurricane count in 5-year intervals since 1900. Data from Runkle et al., Texas State Summaries, appended with updated hurricane data from NOAA Historical Hurricane Tracks.
Houstonians are well versed in the distinction between frequency and destructive power. One hurricane can permanently alter a community regardless of the century-long trend. Katy Christian Magazine’s history of the 1900 Galveston hurricane and the destruction it carried inland to Katy recounts such a disaster from a time when global greenhouse gas emissions were far lower than they are today.
The assessment’s tornado chart uses reports from NOAA’s Storm Prediction Center for 1995 through 2025 and finds no increase in annual Texas tornado counts. Burnett summarized the report’s conclusion directly: “There is no trend of worsening hurricanes or tornadoes.”
 Annual tornadoes for Texas, 1995-2025. Data from NOAA Storm Prediction Center, Severe Weather Report Database. 2025 count was preliminary at the time this report was compiled.
Texas Farms Are Producing More From Each Acre
The agricultural section offers the report’s clearest good-news story. Texas leads the country in cotton and hay production, and its farmers now harvest far more from each acre than farmers did at the beginning of the 20th century.
USDA data compiled for the assessment show that Texas cotton yield per acre increased 168% from 1900, while corn yield rose 575%. Total cotton production increased 46%, and corn production increased 199%. Hay and haylage yield increased 10% between 1994, when the report’s series begins, and the latest year studied.
Burnett attributes those gains to several forces working together. Mechanization allowed farmers to cultivate and harvest land more efficiently. Fertilizers, pesticides, improved crop varieties, irrigation and modern farm management raised production further. He also credits modestly higher average rainfall, fewer late-season freezes and the effect of increased atmospheric carbon dioxide on plant growth and water efficiency.
“Technology, especially fossil fuel-powered mechanization and the use of fossil fuel-based fertilizers and pesticides, and modern farming practices have certainly contributed significantly to Texas’ improved agricultural production and yields,” Burnett said.
Rising yield does not erase the financial, regulatory and development pressures facing individual farmers. Katy Christian Magazine has previously examined the loss of agricultural land in “Farmland Lost Is Farmland Lost Forever”and the relationship between environmental policy and local decision-making in “The Devil Is in the Details: Education, Climate Change and the Fight for Local Control.”
The new assessment tracks the statewide output from each acre. Across the century-long cotton and corn series, those yield lines rise sharply.
Burnett’s conclusion reaches beyond any single chart. He accepts that climate changes and that Texas has warmed. He disputes the claim that the historical measurements establish an escalating emergency.
“Climate change occurs and always has, but current climate change is not outside of historical patterns, and there is no evidence it is calamitous,” Burnett said. “There is no climate crisis in Texas or across the United States.”
That position places the report squarely inside the national argument over how weather data should shape public policy. Katy Christian Magazine has published related commentary on environmental stewardship and the politics surrounding Earth Day. Burnett’s contribution is a Texas-specific case built from the state’s temperature, rainfall, storm, fire and agricultural records.
Those records describe a state with dangerous weather, wide natural swings and rapidly growing cities. They also show why a headline about the latest drought or heat wave cannot, by itself, answer the larger climate question.
Feature photo by Matt Palmer on Unsplash